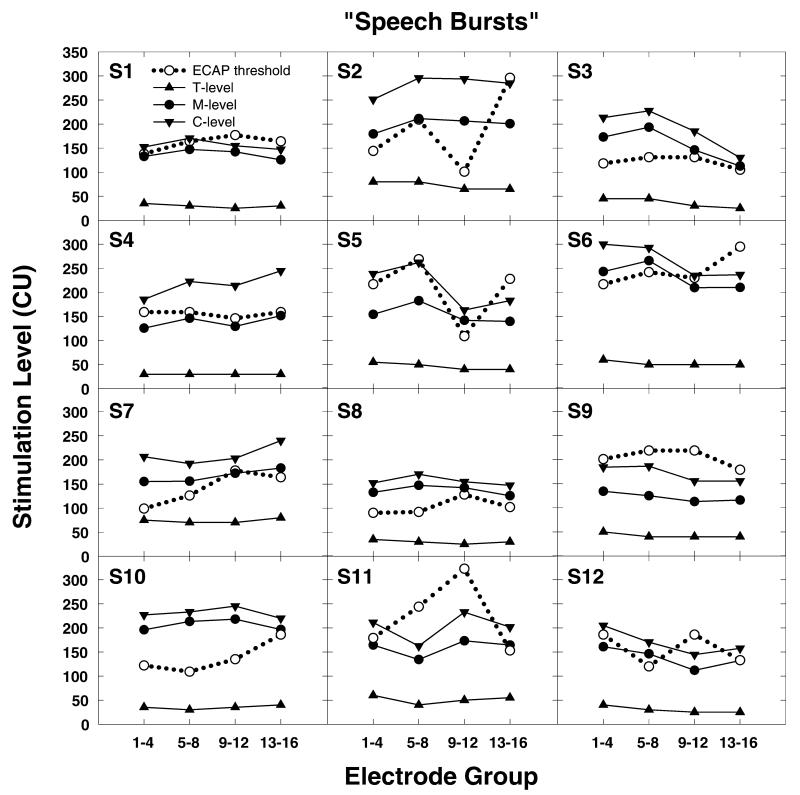
Figure 4.
Individual data from all 12 study participants showing the relationship between loudness judgments obtained using a speech burst stimulus and ECAP thresholds. Loudness measures are plotted using filled symbols and solid lines. ECAP thresholds are plotted using open circles and dotted lines. Stimulation level is specified in clinical programming units (CUs).

