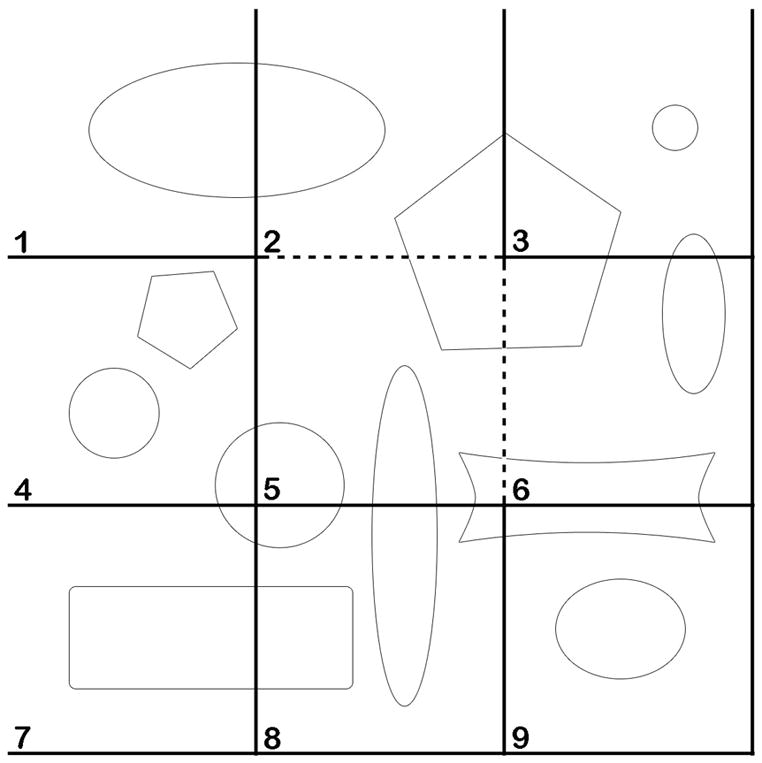
Figure 2.

Application of the counting frame. By dividing a planar region into consecutively numbered frames, profiles can be counted and an accurate estimate obtained from a sample fraction. Frame 2 demonstrates the counting rules for an individual frame: All profiles within the frame are counted as long as they do not touch the exclusion line (solid line) that extends to infinity. All profiles within the frame, partly or completely, in addition to those touching the inclusion line (dashed line) are counted. To estimate the total number of profiles by counting one third of the population, every third frame would be counted after randomly starting with any one of the first three frames. This would result in the assessment of frames: 1, 4, and 7 (counting 5 profiles), 2, 5, and 6 (counting 3 profiles), and 3, 6, and 9 (counting 3 profiles). The mean of these three counts is 3.66, the correct number of one third of the population.
