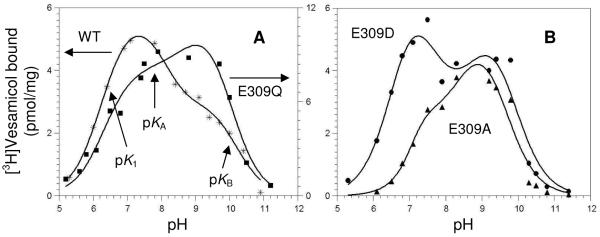
FIGURE 4.
pH profiles for vesamicol binding. Shown in Frame A are wild-type (WT, *) and E309Q (■). Shown in Frame B are E309A (◆) and E309D (●). Low, subsaturating concentrations of post-nuclear supernatant (20 μg/mL or 100 μg/mL for E309A) and [3H]vesamicol (5 nM or 20 nM for E309A, as it binds more weakly) were incubated 10 min for all mutants. The three-proton model of VAChT binding to protonated vesamicol (abbreviated version shown in Scheme 1) was fitted to the data, and the resulting parameter values are listed in Table 3. The approximate pH regions dominated by pK1, pKA, and pKB are indicated with the arrows pointing upward in Frame A.

