
FIGURE 6.
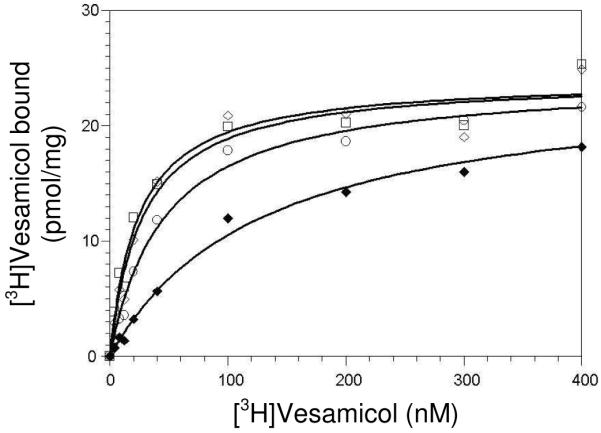
Vesamicol saturation curves for E309K at pH 7.4 (◆), pH 8.5 (○), pH 9.3 (◇), and pH 10.2 (□). The concentration of [3H]vesamicol along the x-axis includes protonated and unprotonated forms of vesamicol. Eq. 2 and 3 were fitted simultaneously to the data as described in Results. Table 4 lists the derived parameter values.