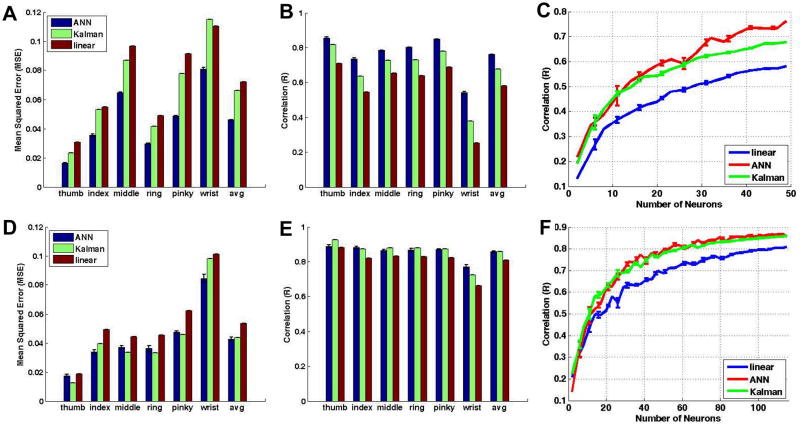
Figure 4.
Mean square errors and correlation coefficients for monkey C (top row) and monkey K (bottom row). All movements are decoded with high accuracy, although all three decoding models performed worst with wrist movements. Plots of the average correlation coefficient as a function of number of neurons (right column) show that the linear filter (blue) performed worse than both the ANN (red) and Kalman filter (green).

