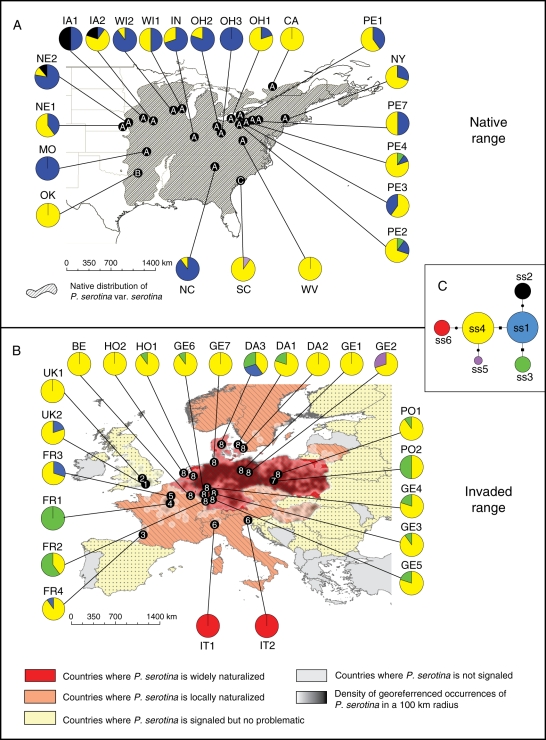
Fig. 1.
Geographical distribution of nuclear and chloroplast genetic variation in Prunus serotina. (A) Native range with sampling locations. The hatched area indicates the natural occurrence of P. serotina var. serotina in the wild. Dots on the map represent the three genetic clusters defined by Baps based on nuclear microsatellite data. These dots are labelled from A to C according to the cluster they belong to. Pie charts represent the relative proportions of cpDNA haplotypes in a population, as indicated in (C). (B) Invasive range with sampling locations. Dots on the map represent the eight genetic clusters defined by Baps based on the nuclear microsatellite data. The dots are numbered from one to eight according to the cluster they belong to. (C) Median-joining network of cpDNA haplotypes. The size of the circles represents the relative frequency of the haplotypes. The biggest size corresponds to haplotypes with a frequency >10 %, the intermediate size corresponds to haplotypes with a frequency between 1 and 10 % and the smallest size corresponds to haplotypes with a frequency <1 %. Steps between haplotypes are either insertion/deletion (i.e. length variation – dots) or nucleotide substitutions without length variation (squares).

