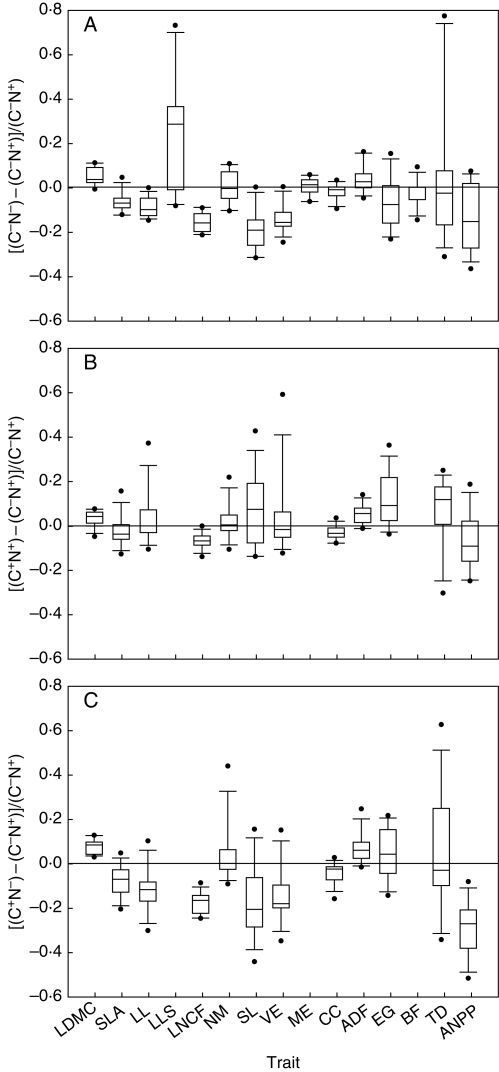
Fig. 1.
Box-and-whisker plots of the responses to (A) nitrogen supply (N), (B) cutting frequency (C−, C+), and (C) N × C factors of traits and above-ground dry matter productivity (ANPP). Values are means of 2 years per species (n = 13). The centre lines within each box show the location of the sample medians. The lower whisker is drawn from the lower quartile to the smallest point within 1·5 interquartile ranges from the lower quartile. The other whisker is drawn from the upper quartile. See Table 1 for trait code.

