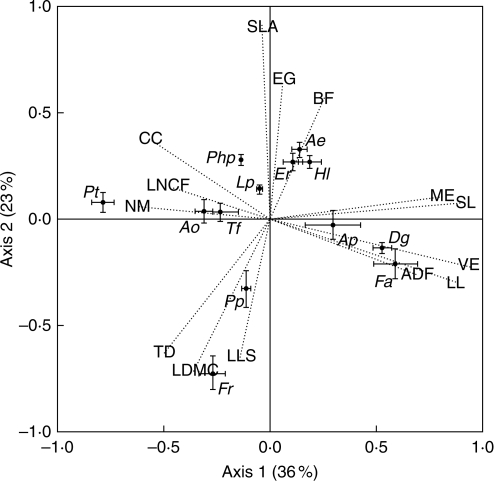
Fig. 2.
Principal components analysis between traits measured under high N supply and low cutting frequency. The two orthogonal axes explain 36 % and 23 % of the variance, respectively. See details of abbreviations in Table 1. Error bars in species indicate the s.e. for each species along axes 1 and 2 (n = 39). Ap, Alopecurus pratensis; Ao, Anthoxanthum odoratum; Ae, Arrhenatherum elatius; Dg, Dactylis glomerata; Er, Elytrigia repens; Fa, Festuca arundinacea; Fr, Festuca rubra; Hl, Holcus lanatus; Lp, Lolium perenne; Php, Phleum pratense; Pp, Poa pratensis; Pt, Poa trivialis; Tf, Trisetum flavescens.

