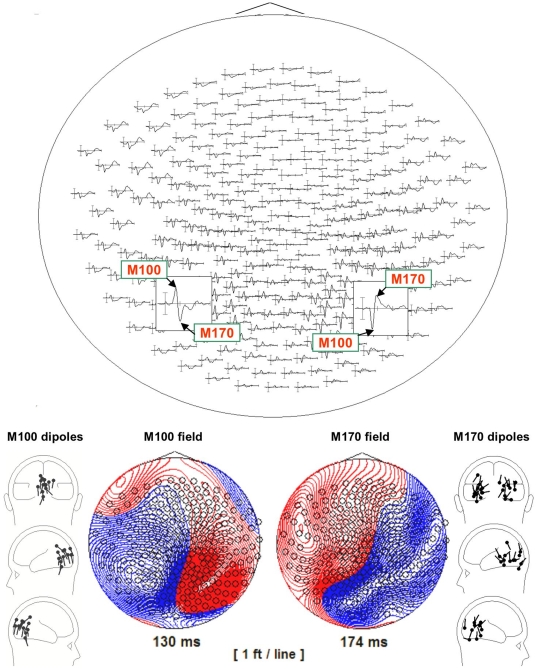
Figure 2. Across subjects grandaveraged response to all the critical items of Exp. 2 depicting the M100 and M170 components.
The gridmap on top shows the components in sensor-space. The bottom panel depicts the field maps associated with the components. On the far left and right, the dipole localizations of all the M100s and M170s of this study are plotted within a representative subject's head frame.

