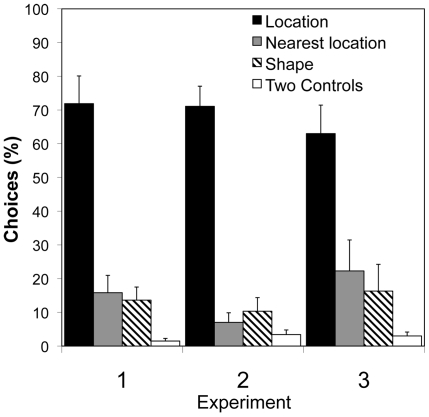
Figure 3. Location versus Shape Tests.
Mean percentage of choices (+/− S. E.) of 10 bats are shown for Experiments 1 (flower bats and strong shapes), 2 (flower bats and strong scents), and 3 (fruit bats and strong shapes). Percents do not add up to 100 because previously rewarded shapes or controls can also be nearest locations.

