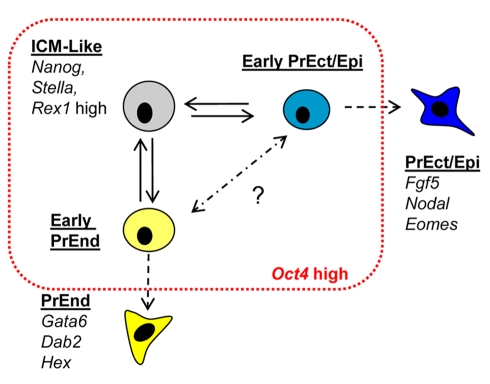
Figure 9. A model for the dynamic equilibrium that exists in ES cell culture.
The schematic diagram depicts the potential cell subtypes that make up ES cell culture. The red line represents the boundary established by the culture conditions. We depict an early PrEn precursor cell defined by the V+S+ phenotype in light yellow, expressing low levels of PrEn determinants such as Hex and Gata6. This cell type is shown in equilibrium with an ICM-like cell. A hypothetical PrEc cell implied by the findings of others is indicated in blue.

