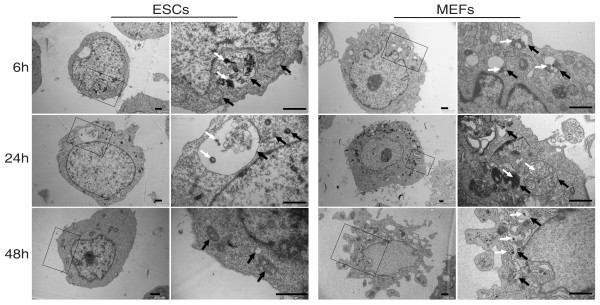
Figure 4.
Transmission electron microscope observation of intracellular QD distribution in ESCs and MEFs. Representative cells at 6, 24, 48 hours after labeling are shown. Higher magnifications of the squared area in the left columns at each time point are shown in the right columns for both ESCs and MEFs. Black arrows: vesicles; White arrows: QD aggregates; Bars: 500 nm.

