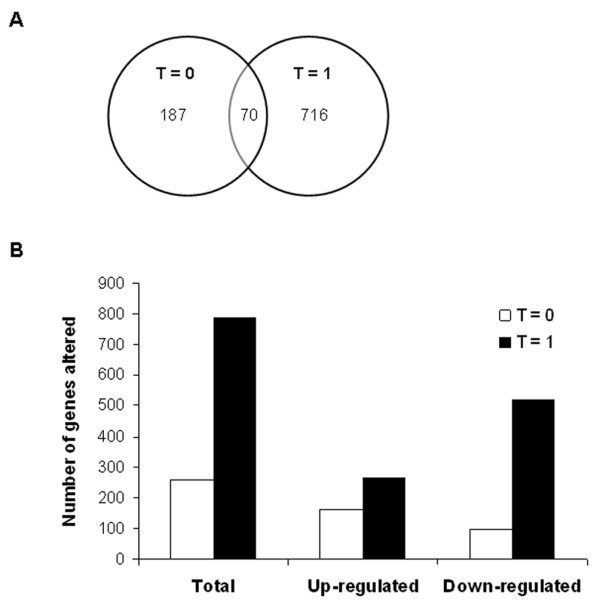
Figure 2.

Analysis of microarray data. (A) Venn diagram depicting the overlap of differentially expressed genes at the onset of surgery (t = 0) and at 1 hour into surgery (t = 1). (B) Numbers of genes demonstrating a minimum of 1.5 fold-change in expression at the two time-points studied.
