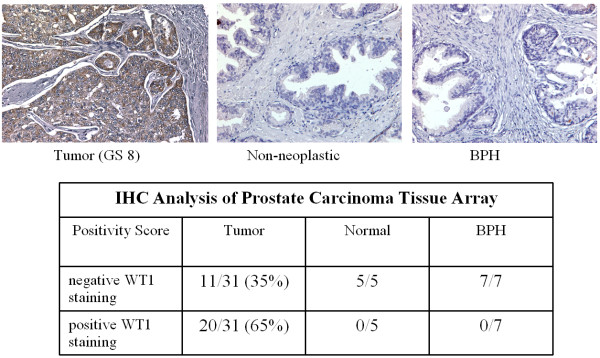
Figure 4.
Immunohistochemical analysis of WT1 expression in prostate tissue microarrays. Top Panel. FFPE tissues were stained as described in text using WT1 polyclonal antibody (Epitomics). Representative fields of tumor tissue (left, Gleason Score 8) and normal (center) and BPH samples (right) panels show WT1 protein expression (brown) limited to tumor epithelium. Bottom Panel. Relative staining intensity was scored as described in text. Duplicated cores samples from 31 patients with Gleason score 6-10 (nearly half were high grade, Gleason 8-10) and 7 patients with BPH and 5 samples of normal tissue from cancer-free prostates were analyzed. Positive WT1 staining was seen in 65% of patient samples examined.

