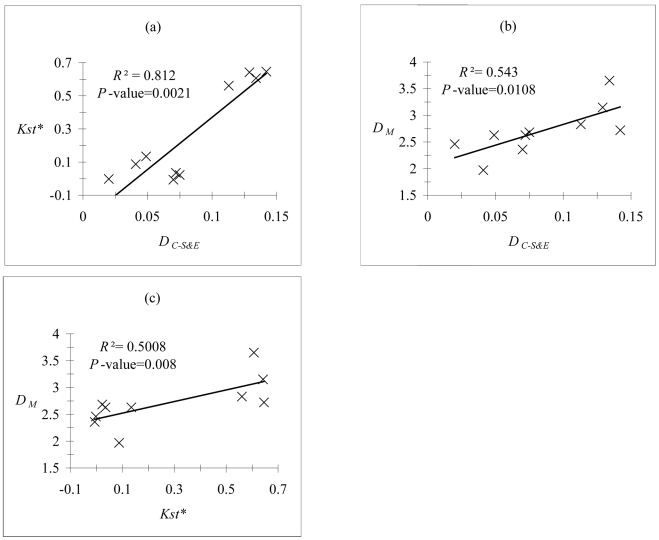
Figure 5. Mantel correlation tests (P-values) between the different markers used in this study.
Mantel correlation tests and percentages of variance explained (R 2) between (a) Cavalli-Sforza and Edwards (DC-S&E) computed from microsatellite data and Kst* computed from COI mitochondrial data, (b) DC-S&E and Mahalanobis distance (D M) computed from morphometric data, and (c) Kst* and D M, for tsetse flies from the five different samples from Senegal (10 distances).

