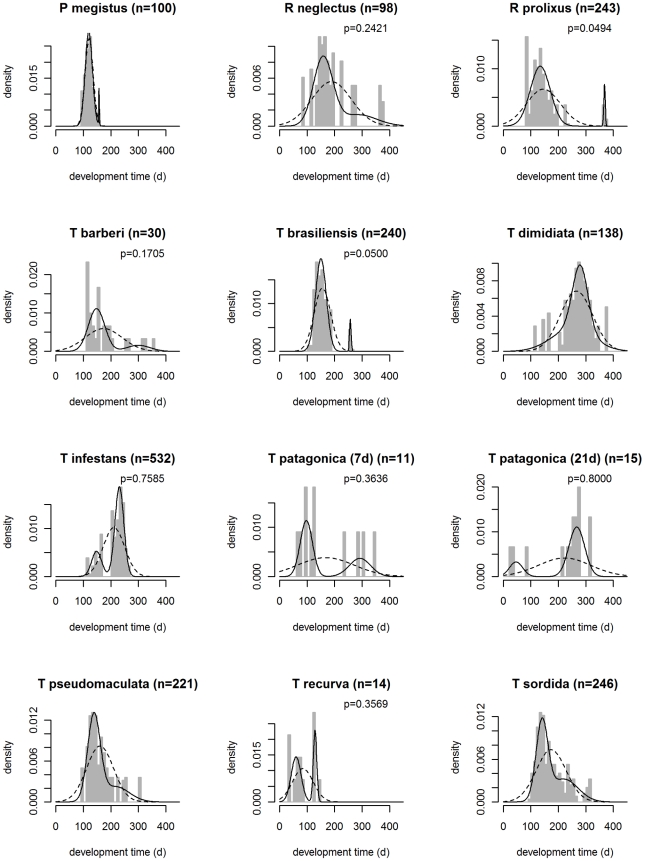
Figure 2. Distribution of the development time of the 5th instar nymphs of eleven triatomine species.
The histogram represents the experimental data. The fitted normal distributions are the uni-modal (dotted line) with expectation and standard deviation set to the mean and standard deviation of the overall development time, and bimodal (solid line) with expectations, standard deviations, and relative contributions estimated by maximizing a likelihood function (see text). The letter p indicates the proportion of individuals with development delay. The analysis of T. patagonica was carried out for data under two feeding conditions: fed every week (7d) and fed every three weeks (21d).

