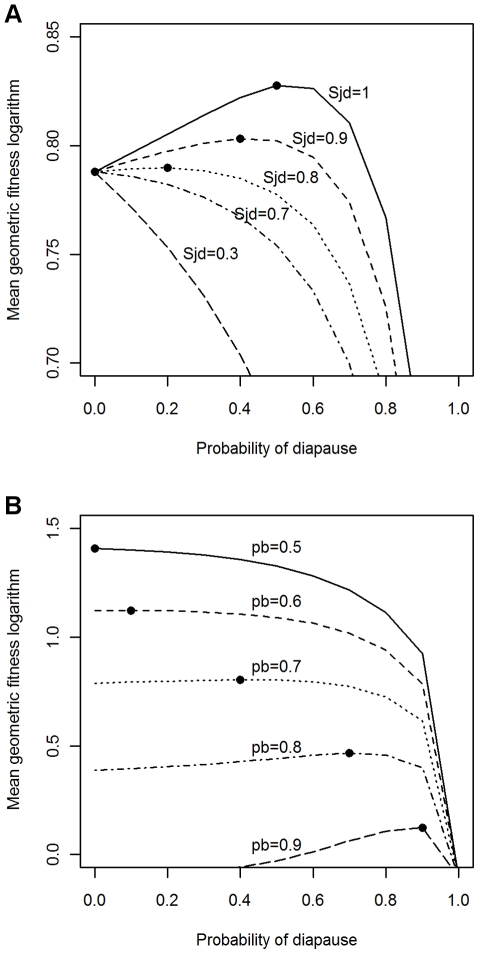
Figure 4. Optimal diapause frequency predicted by the stochastic model.
Variation of the logarithm of the mean geometric fitness as a function of the probability of diapause in the juvenile stage (x axis), and with environmental stochasticity applied only on fecundity (fecundity was multiplied by εg = 1 or by εb = 0.0001 when the random periods were “good” or “bad”, respectively). (A) Effects of varying the juvenile survival during diapause (Sjd) when the probability of occurrence of “bad” periods is fixed to 0.7. (B) Effects of varying the probability of occurrence of the “bad” periods (pb) when survival rate of the diapausing juveniles is fixed to 0.9. The circles represent the probability of diapause corresponding to the maximum value of the logarithm of the mean geometric fitness (optimal strategy) for each line. In both graphs total fecundity, adult survival rate and active juvenile survival rate are 300, 0.5 and 0.7, respectively.

