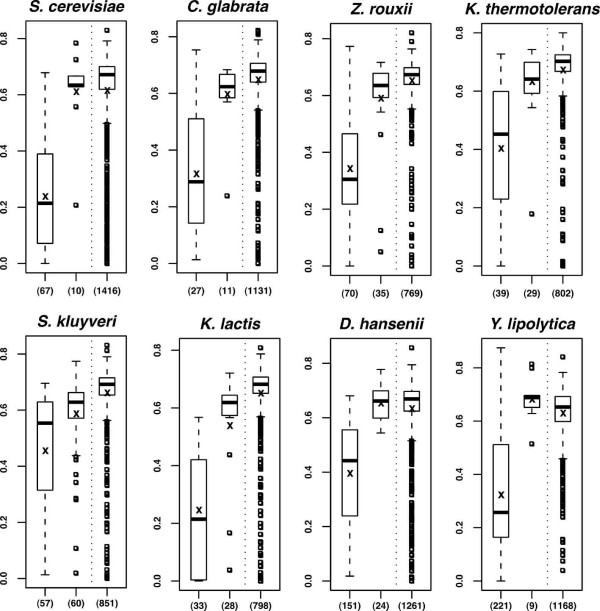
Figure 1.
Boxplot [67]of the sequence divergence between pseudogenes and their closest functional homolog. P-distance (ordinate) is expressed as the fraction of non-identical nucleotides at the third positions of codons (see Methods). Left panel: p-distance of pseudogenes whose closest functional homolog (bestmatch) is in the same genome (paralog), central panel: p-distance of pseudogenes whose bestmatch is in another genome, right panel: p-distance of pairs of functional paralogs in the same species. The number of pairs analyzed is indicated in parenthesis (data in Table II).

