
Figure 6.
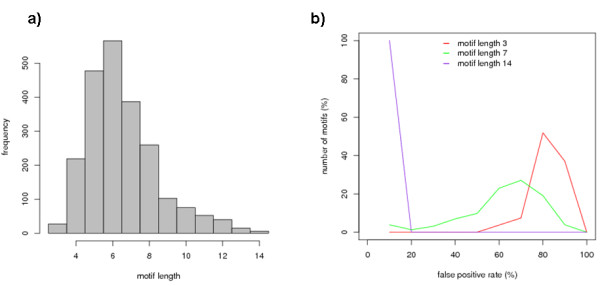
Distributions. a) Distribution of the derived statistically significant motifs for different motif lengths. b) Percentage of motifs vs false positive rate for motifs of lengths 3, 7 and 14.
Official websites use .gov
A
.gov website belongs to an official
government organization in the United States.
Secure .gov websites use HTTPS
A lock (
) or https:// means you've safely
connected to the .gov website. Share sensitive
information only on official, secure websites.
Distributions. a) Distribution of the derived statistically significant motifs for different motif lengths. b) Percentage of motifs vs false positive rate for motifs of lengths 3, 7 and 14.