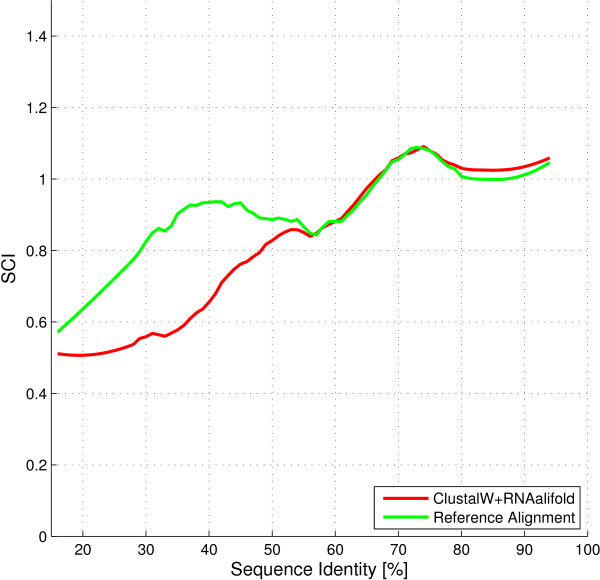
Figure 1.
Performance of Plan A. Performance of a Plan A approach for RNA families with different levels of sequence identity. The "twilight zone" extends from approx. 55% sequence identity to the left. The reference alignments were taken from BRAliBase. Filtering with a Savitzky-Golay filter was applied afterwards to smoothen the graph.

