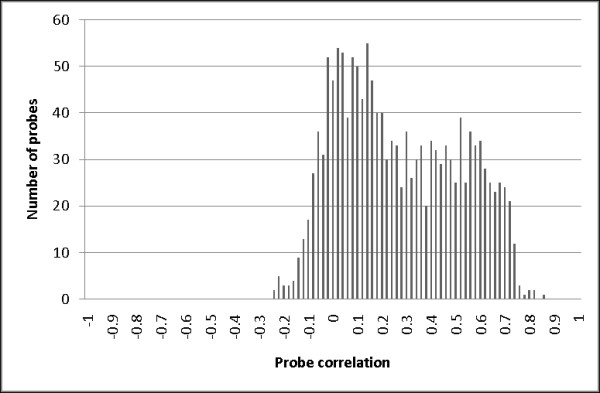
Figure 1.

The distribution of probe correlations. The distribution of probe-level correlations across technical replicates for each probe is shown. Pearson correlation coefficients were calculated for the 1505 CpG probes using 126 replicate biosamples distributed across five methylation matrices.
