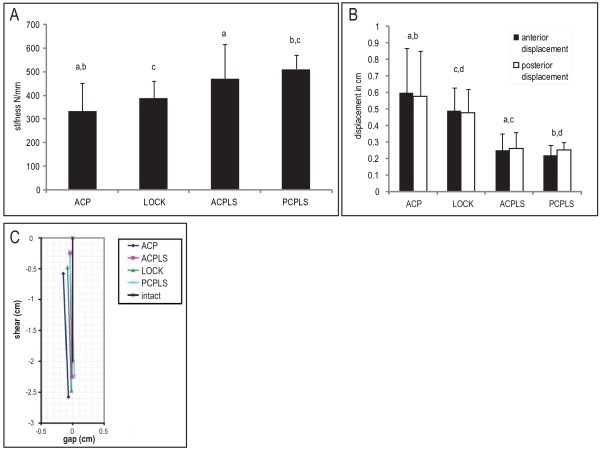
Figure 4.
(A) Mean stiffness (N/mm) and standard deviations for different fixation modalities. (B) Displacements measured for the anterior (black) and posterior (white) gaps during loading from 0 to 2000 N for four different pelvic fracture fixation modalities. Values with common superscripts are significantly different (p < 0.05). (C) A diagram representing average displacement at the fracture site for the four different fixation schemes is shown. The reference superior edge of the fracture line is represented by the solid vertical black line in the central-upper part of this figure. The colored lines to the left and below this reference line represent the average location of the opposing inferior fracture edges after load is applied, and are based on the movement of the pins in the photographs as seen in Figure 3. Motion in the -X direction represents opening of the fracture gap and -Y represents shear motion at the fracture site. The single column fixation schemes (ACP and LOCK) displaced approximately twice as much as the two-column fixation schemes (ACPLS and PCPLS).

