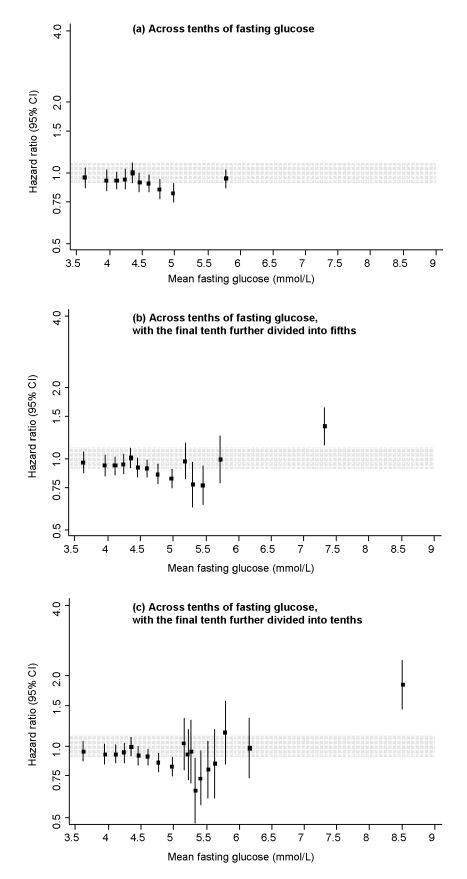
Figure 1. Risk of CHD across tenths of baseline fasting glucose levels in the Reykjavik Study.
All hazard ratios are adjusted for age, sex, recruitment period, smoking status, systolic blood pressure, total cholesterol, and BMI, and all are compared to individuals in the middle tenth of the distribution. The grey area denotes the 95% CI of the reference group. Analyses involved the full range of glucose values (i.e., including individuals with glucose levels in the diabetic range). To limit any bias related to having a diagnosis of diabetes (e.g., medication use, lifestyle changes), however, individuals with a known history of diabetes at the baseline survey were excluded.

