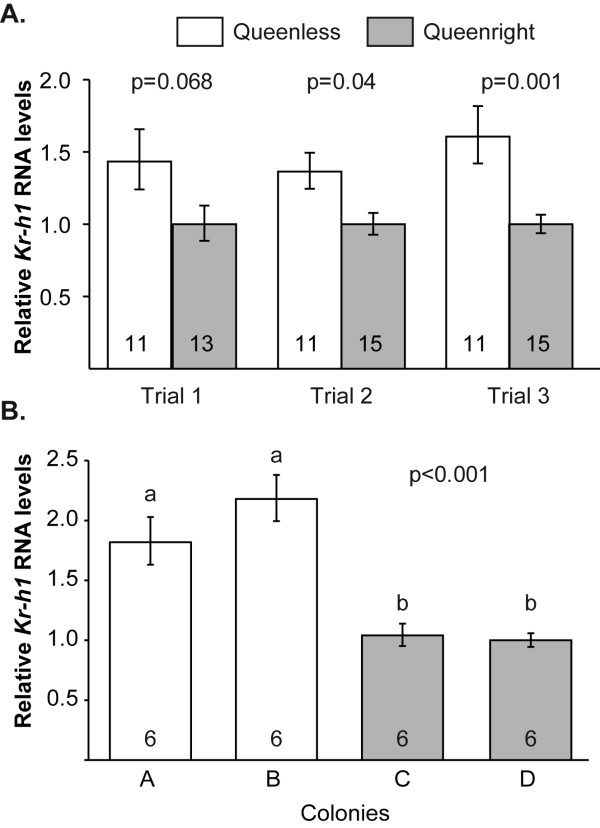
Figure 1.
The influence of queen presence on brain Kr-h1 levels in workers. A. In the first experiment we compared workers from queenright colonies and workers of similar age and genotype that developed in small queenless groups. Data represent mean ± standard error of mean. The number of individual brains used in each sample is shown in the base of each bar. P-values above plots were obtained from unpaired t-test analyses. B. In the second experiment we compared queenless and queenright workers that developed in colonies with similar worker and brood populations, but differing in the presence or absence of an egg-laying queen. Sample size was 6 bees/colony. Groups with different letters are significantly different in a one-way ANOVA followed by a LSD post hoc test (P < 0.001 for both tests).

