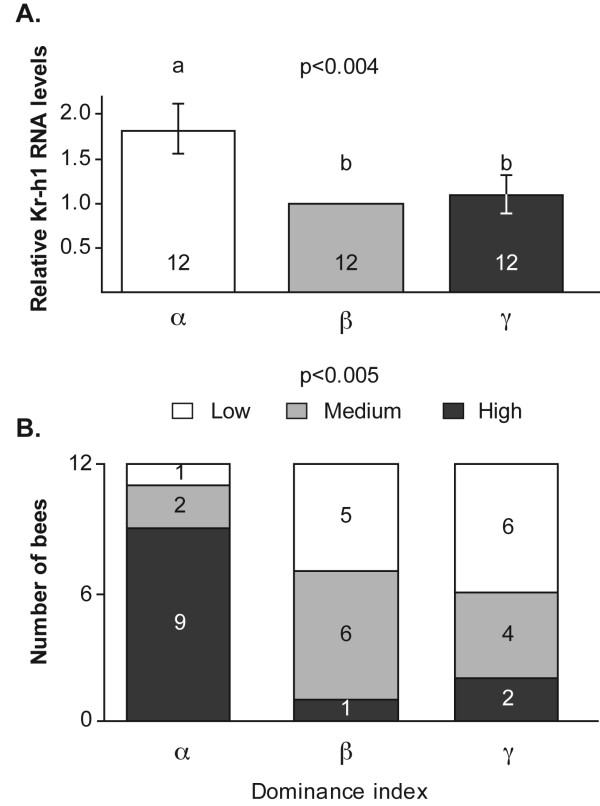
Figure 3.
The influence of dominance rank on brain Kr-h1 levels in groups of three queenless workers. A. Average brain Kr-h1 RNA levels for bees with different dominance rank. Data represent mean ± standard error and the sample size is indicated within bars. The P-value was obtained from a one way ANOVA. Groups with different letters are significantly different in a LSD post hoc statistical test (P < 0.05). B. The proportion of bees in each dominance rank with the highest, medium, and lowest brain Kr-h1 RNA levels. The numbers inside the bars show the number of bees fitting each category. The P-value above plot shows the result of a Chi square goodness of fit test comparing the observed values to an expected probability of 0.33 if dominance and Kr-h1 levels are independent.

