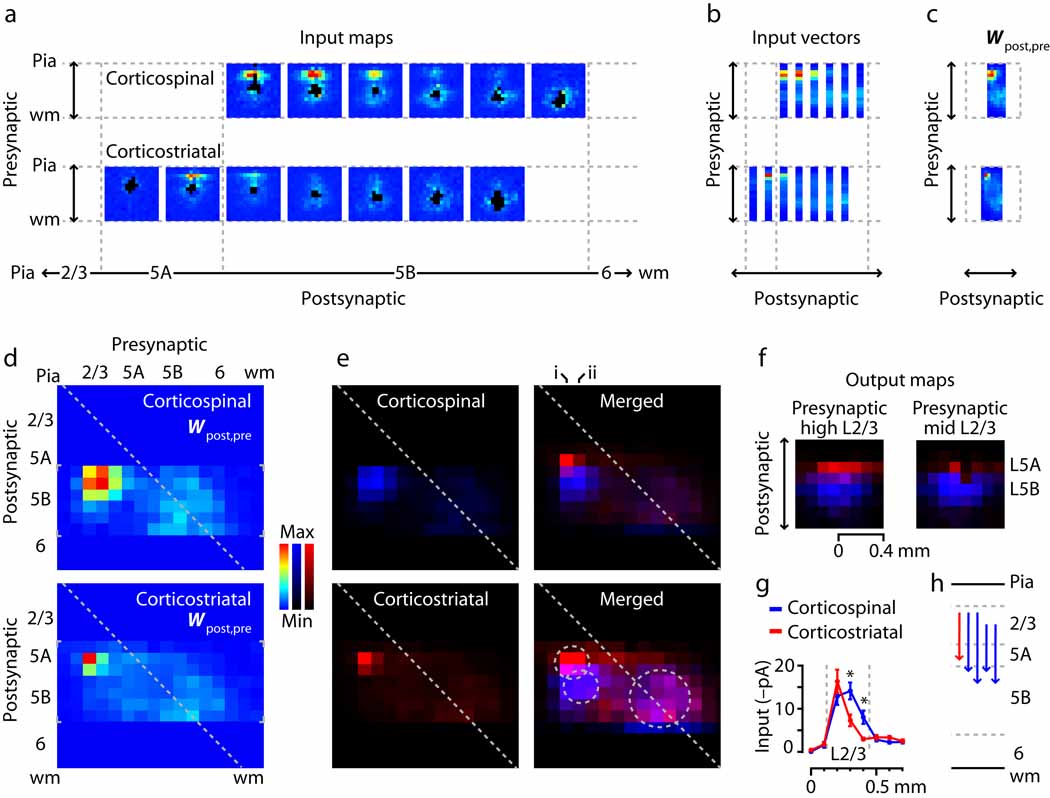
Fig. 7.
Laminar connectivity matrix analysis, showing partial segregation of L2/3 inputs to corticostriatal and corticospinal neurons. (a) Average input maps, generated by sorting individual cells’ maps by soma position, binning, and averaging. (b) Average input vectors, made by averaging the input maps along map rows. (c) The set of input vectors constitutes a laminar connectivity matrix (Wpost,pre). (d) Connectivity matrices for the two projection neuron classes. Small gray brackets indicate the data-containing regions. (e) Same as in panel d, but with the matrices on separate color scales (left; corticospinal: blue, corticostriatal: red) and merged (right; same color scales; magenta represents overlap). Image in lower right is same as in upper right but on a compressed color scale; two smaller circles mark the hotspots of layer 2/3 input, and larger circle marks region of layer 5/6 input. (f) Synaptic output maps, computed for presynaptic neurons in upper layer 2/3 (left; corresponds to column i in panel e) and mid layer 2/3 (right; corresponds to column ii in panel e). See Methods for details. Color definitions same as for panel e. (g) Profile of mean input to the two projection neuron classes as a function of presynaptic stimulus location. Gray lines delimit layer 2/3. Asterisks indicate significant differences (P < 0.05, t-test). (h) The strongest quartile of elements in the connectivity matrices, redrawn as arrows.

