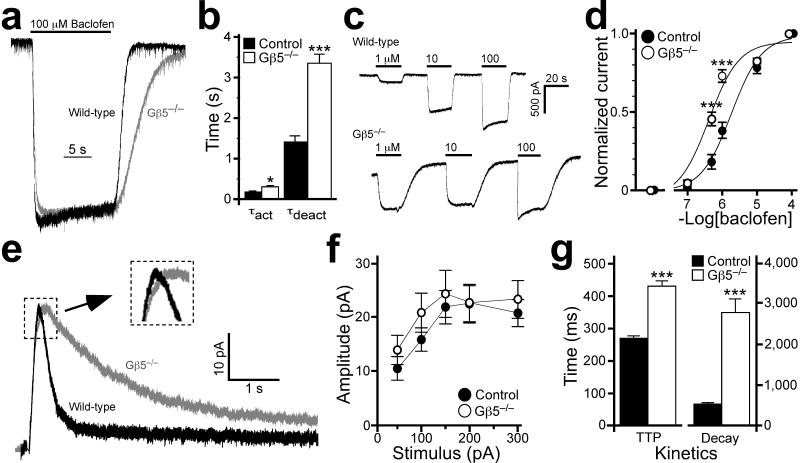
Figure 2. Gβ5 ablation delays GABAB–GIRK signaling kinetics.
a) Representative currents induced by 100 μM baclofen in a wild–type (WT, black) and Gβ5–/– (gray) neuron are normalized to emphasize the genotype–dependent differences in current kinetics. b) Activation (τact) and deactivation (τdeact) kinetics for the baclofen–induced current in control and Gβ5–/– neurons (n = 9–13 per group). Both activation and deactivation kinetics were delayed in neurons from Gβ5–/– mice. c) Representative inward currents measured in neurons from control (upper trace) and Gβ5–/– (lower trace) mice following application of 1, 10, and 100 μM baclofen. Note both the delayed current deactivation kinetics and the enhanced sensitivity to 1 μM baclofen in the Gβ5–/– neuron. d) Concentration–response relationship for baclofen–activation of GIRK current in wild–type (black circles) and Gβ5–/– (open circles) neurons. Steady–state inward currents evoked sequentially by either 0.1 or 0.5 μM baclofen, and then 1 and 10 μM baclofen, were normalized to the response to 100 μM baclofen applied at the end of the experiment (n=10–12 experiments per genotype). Main effects of genotype (F1,73=23.6, P<0.001) and concentration (F5,73=220.4, P<0.001), as well as an interaction between genotype and concentration (F5,73=11.2, P<0.001), were observed. e) Representative slow evoked IPSCs in CA1 neurons from wild–type (black) and Gβ5–/– (gray) mice; amplitudes are normalized to emphasize genotype–dependent kinetic differences. Each trace is an average of 15 sweeps and stimulus artifacts have been removed. Inset, magnified view showing the slower rise of the IPSC in Gβ5–/– mice. f) IPSC amplitude vs. stimulus intensity in control and Gβ5–/– mice (n = 14–18 per genotype). The stimulus response curves were indistinguishable (F1,23=1.0, P>0.05; interaction genotype × input, F3,69=0.6, P>0.05). g) The time–to–peak (TTP) and decay (90–37%) of the evoked IPSCs in wild–type and Gβ5–/– mice. Symbols: *,*** P<0.05 and 0.001 respectively, vs. control. Error bars are s.e.m.

