
Figure 1.
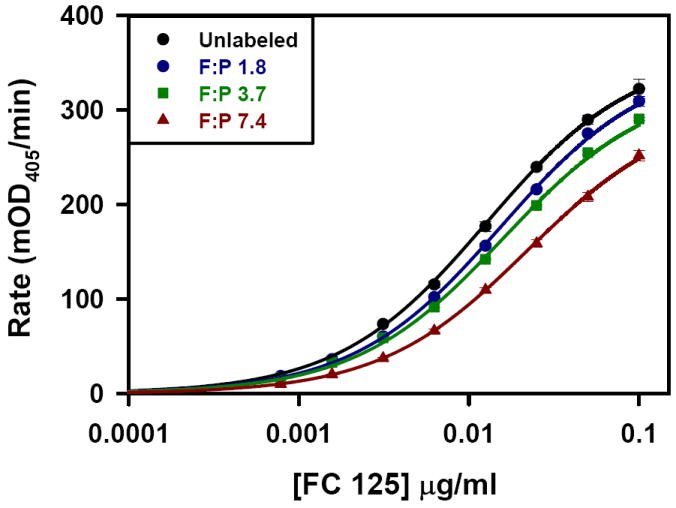
Kinetic ELISA of Fc125 antibody. Fluorophore:Protein dependent rightward shift in the concentration dependent kinetic ELISA rate. The entire data set was fit using Equation 1. The shared parameters, Rmax and K1/2, are the best fit values for the entire data set (361.8 +/- 6.6 mOD405/min and 0.013 +/- 0.000 μg/ml, (fitted value +/- std. error) respectively) while the component values for the vectors α and β are specific to each curve (α = [1, 0.98 +/- 0.02, 0.91 +/- 0.02, 0.84 +/- 0.02] and β = [1, 0.82 +/- 0.04, 0.79 +/- 0.04, 0.57 +/- 0.03] (fitted value +/- std. error).