
Figure 3.
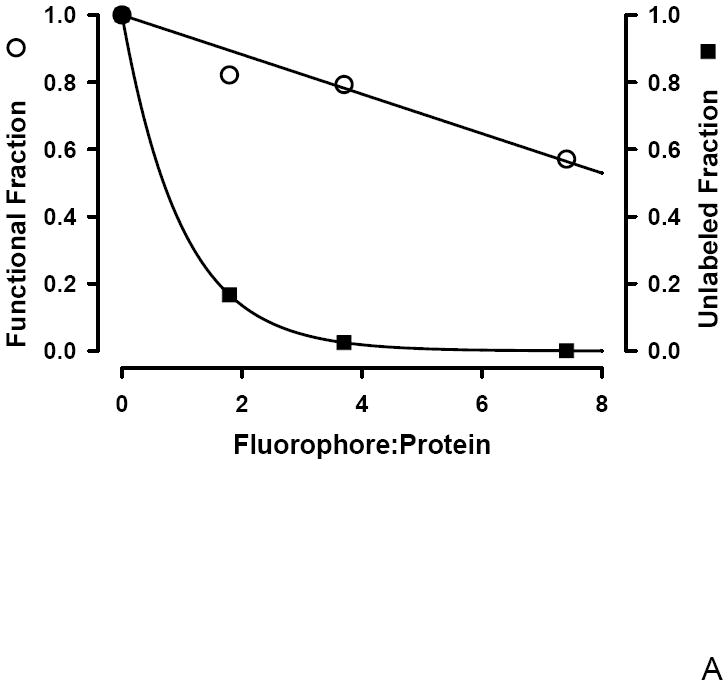
A: Conjugation dependent changes in the functional (○) and unlabeled fractions (■). The unlabeled fraction was calculated using Poisson statistics and the functional fraction is the global linking vector, β.
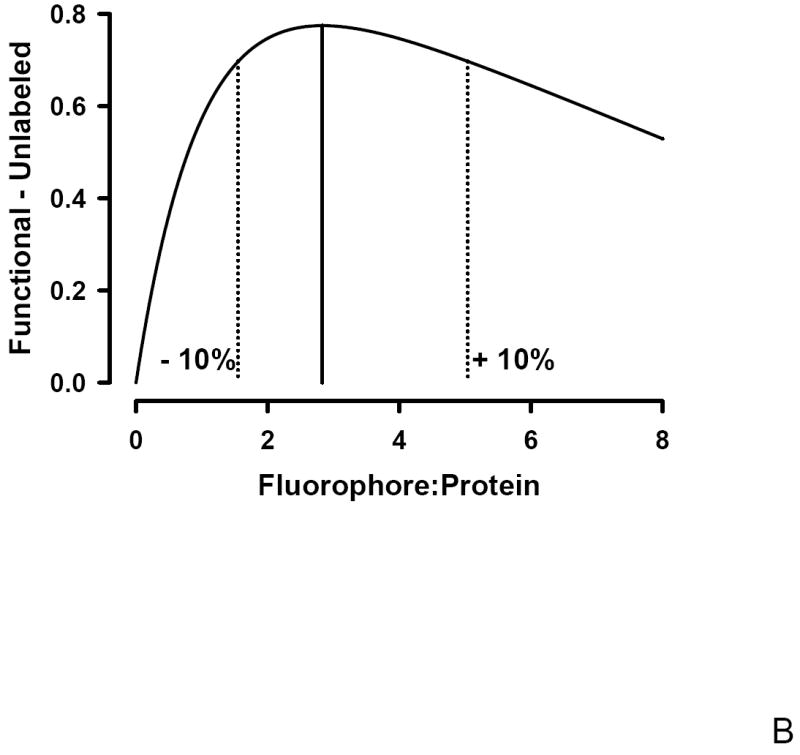
B: The difference between the functional and unlabeled fractions has a maximum at a Fluorophore:Protein ratio of ~3 representing the optimum conjugation level. The dotted lines represent the +/- 10% range about the optimum and corresponds to a F:P ratio of ~ 2 – 5.