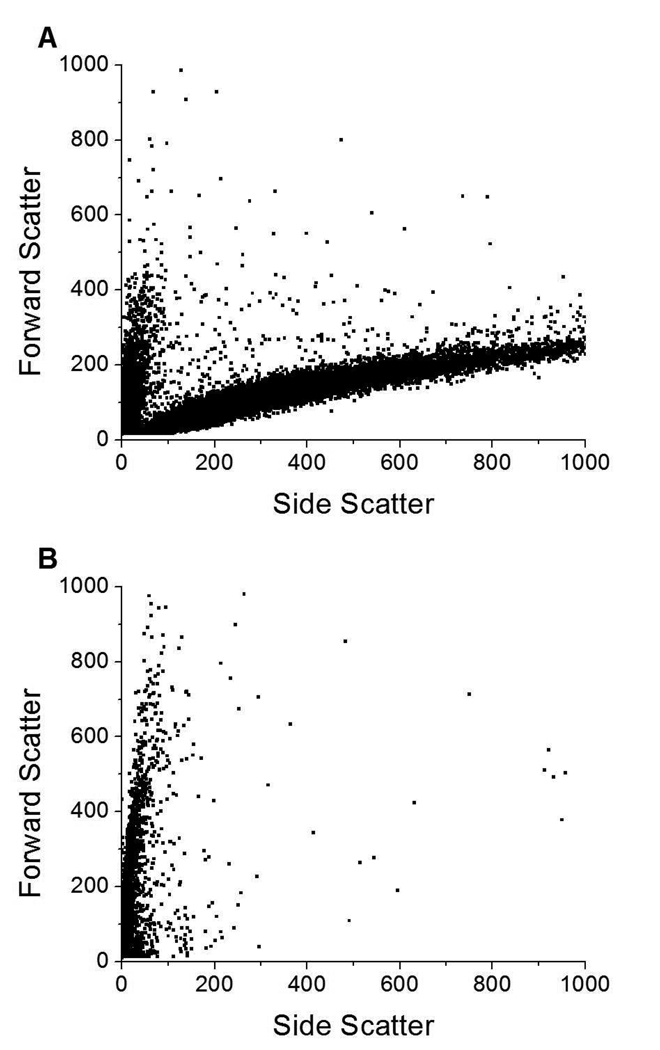
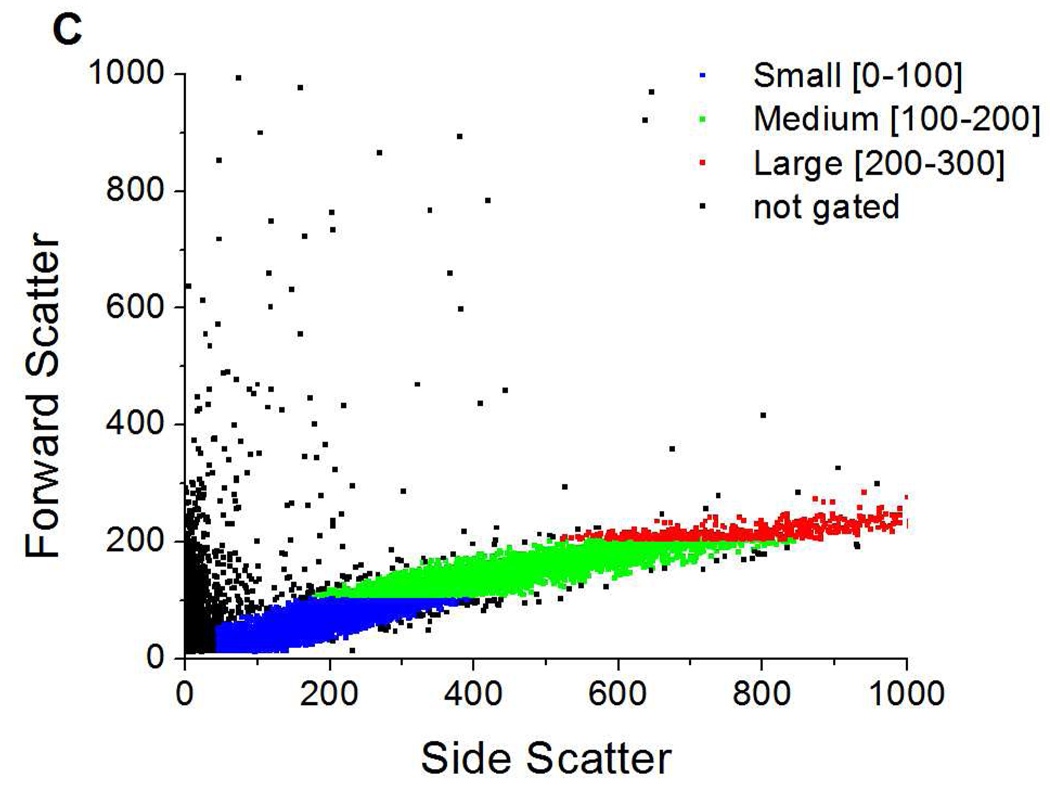
Figure 2.
Forward vs. side scatter dot plots of A) DSPC/DPPS microbubbles; B) fluorescently labeled DSPC/DiC18-B’ small unilamellar vesicles (SUVs); and, C) DSPC/DPPS microbubbles incubated with fluorescently labeled DSPC/DiC18-B’ SUVs for 20 min (0nM DiC18-B – 20 min). Color dots indicate gates based on relative microbubble size: blue (FS = 0–100) – small, green (FS = 100–200) – medium, and red (FS = 200–300) – large. Fluorescent probe was DiOC18.


