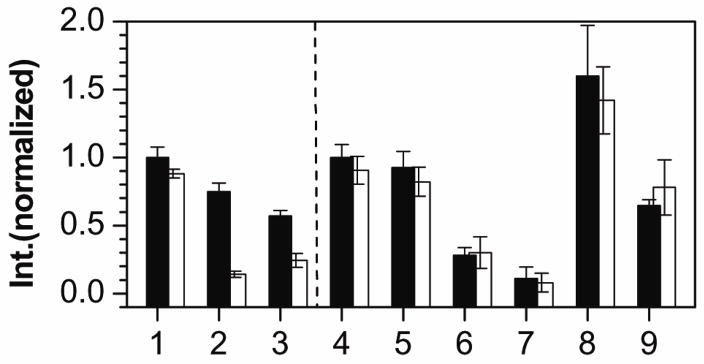
Figure 4.
Translation with RNase H. Normalized peak fluorescence intensity of eGFP and mCherry expression (black columns), and with identical amount of RNase H (white columns). Sample 1: eGFP, 2: eGFP with stDNA (stDNA/mRNA=50), 3: eGFP with AuNP-stDNA (coverage 1:65, AuNP/mRNA=0.4), 4: mCherry, 5–7: mCherry with stDNA (stDNA/mRNA=50, 75, and 100, respectively), 8–9: mCherry with AuNP-stDNA (coverage 1:65, AuNP/mRNA=0.4 and 0.8, respectively).

