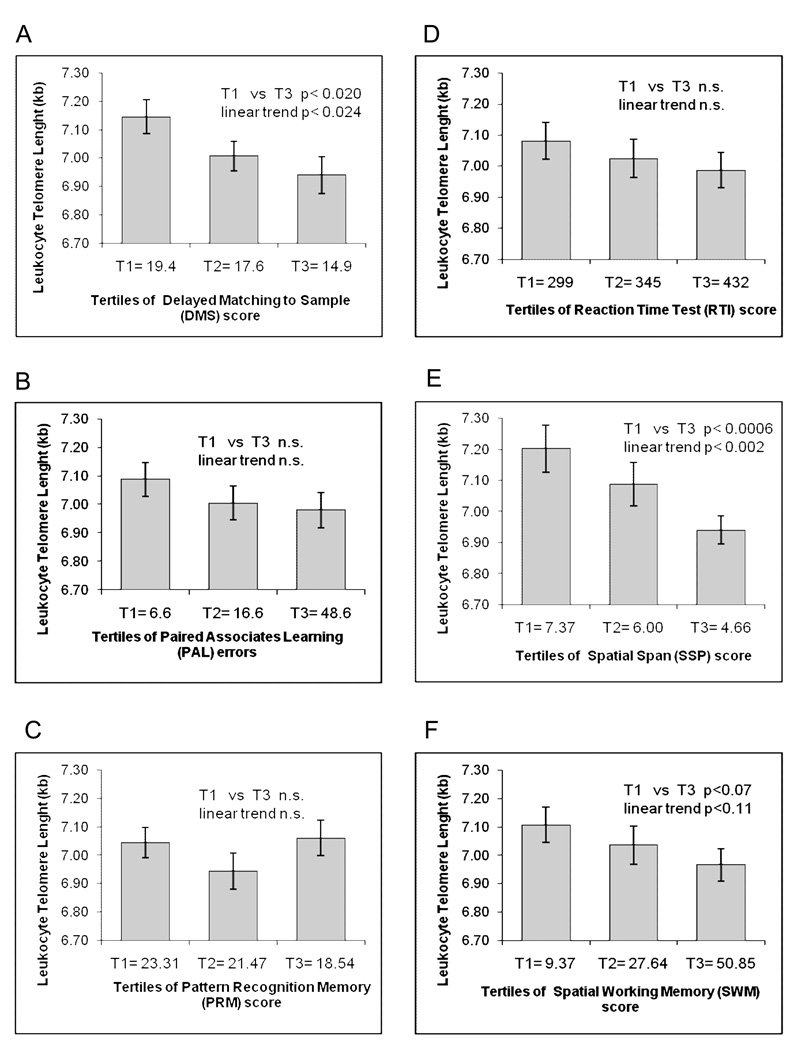
Figure 1.
Adjusted mean leukocyte telomere length adjusted for tertiles of six CANTAB scores. For all CANTAB scores T1 indicates the tertile with the best performance T2 the middle tertile and T3 the tertile with the worst performance. For PAL, RTI and SWM the best tertile (T1) is the tertile with the lowest scores, for DMS, PRM and SSP the best tertile (T1) is the tertile with the highest value. The mean score value for each tertile is shown. Results are adjusted for NART score, and age.

