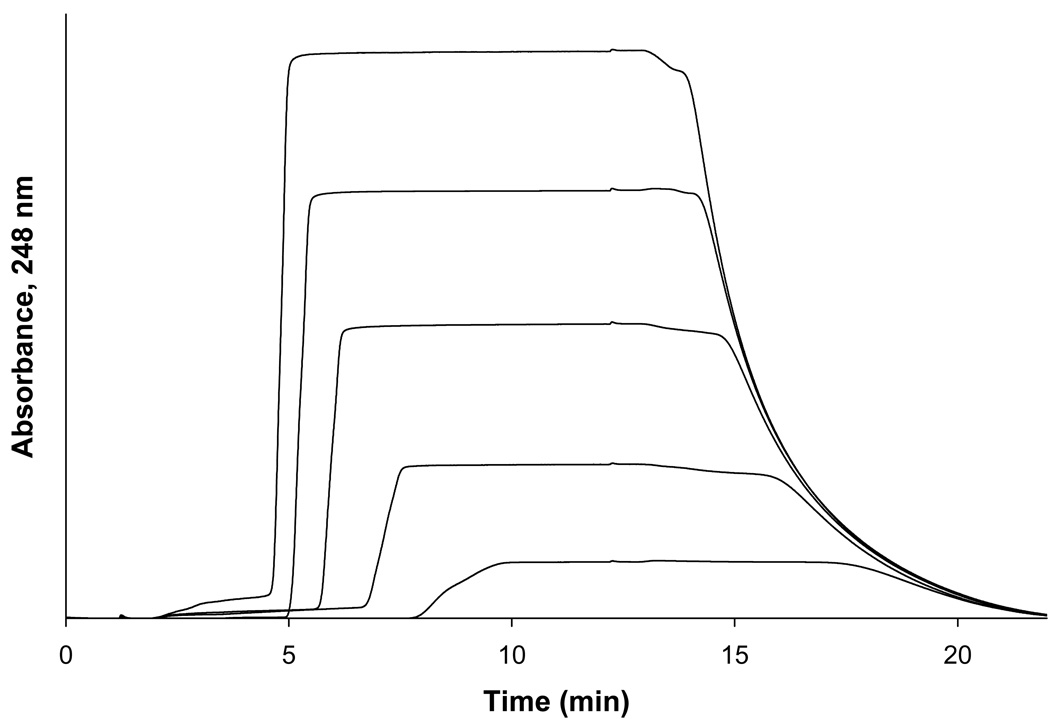
Figure 2.
Breakthrough curves for acetohexamide on an immobilized HSA column at applied concentrations (from left to right) of 10, 7.5, 5, 2.5, and 1 µM. Alternative detection wavelengths were used for some of the higher concentrations of analyte solutions to maintain a linear response in absorbance versus concentration during these studies, as described in the Experimental Section. Other conditions are given in the text.

