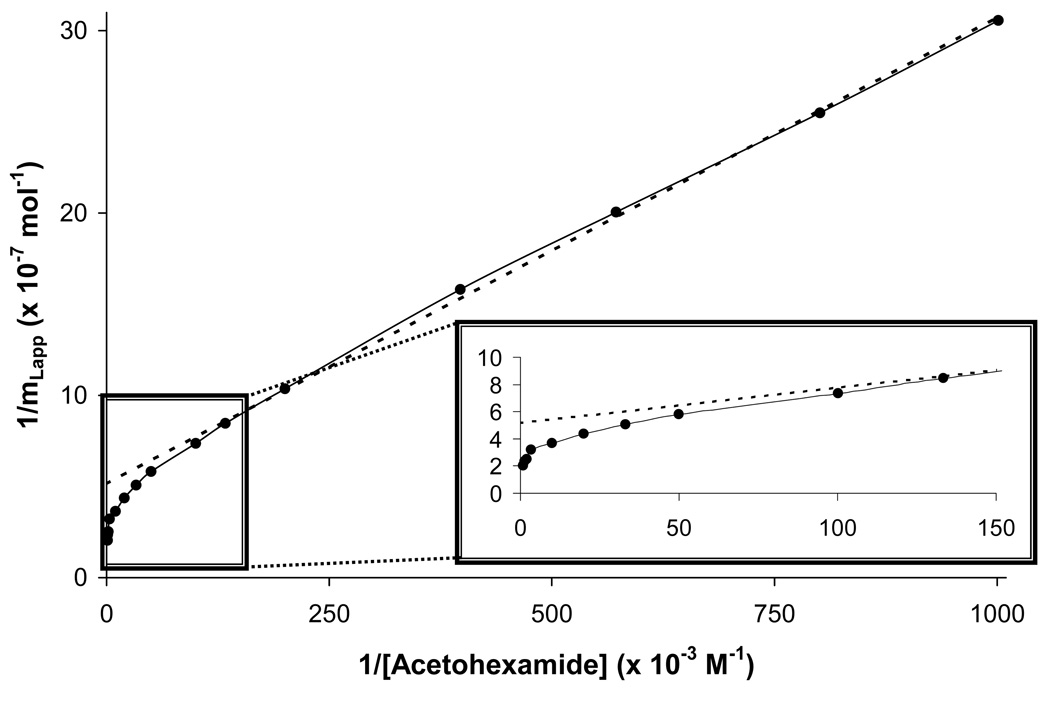
Figure 3.
A double-reciprocal plot for frontal analysis studies examining the binding of acetohexamide to an immobilized HSA column. When comparing this response to the linear relationship that is predicted by Eqn. (1), it was apparent that negative deviations occurred at high analyte concentrations (i.e., low values of 1/[A]), indicating that multiple binding regions for acetohexamide were present. The dashed line shows the linear response that was obtained for the data at relatively low analyte concentrations (i.e., high 1/[A] values), which can still be used in such a case to estimate the association equilibrium constant for the highest affinity binding sites in such a system.

