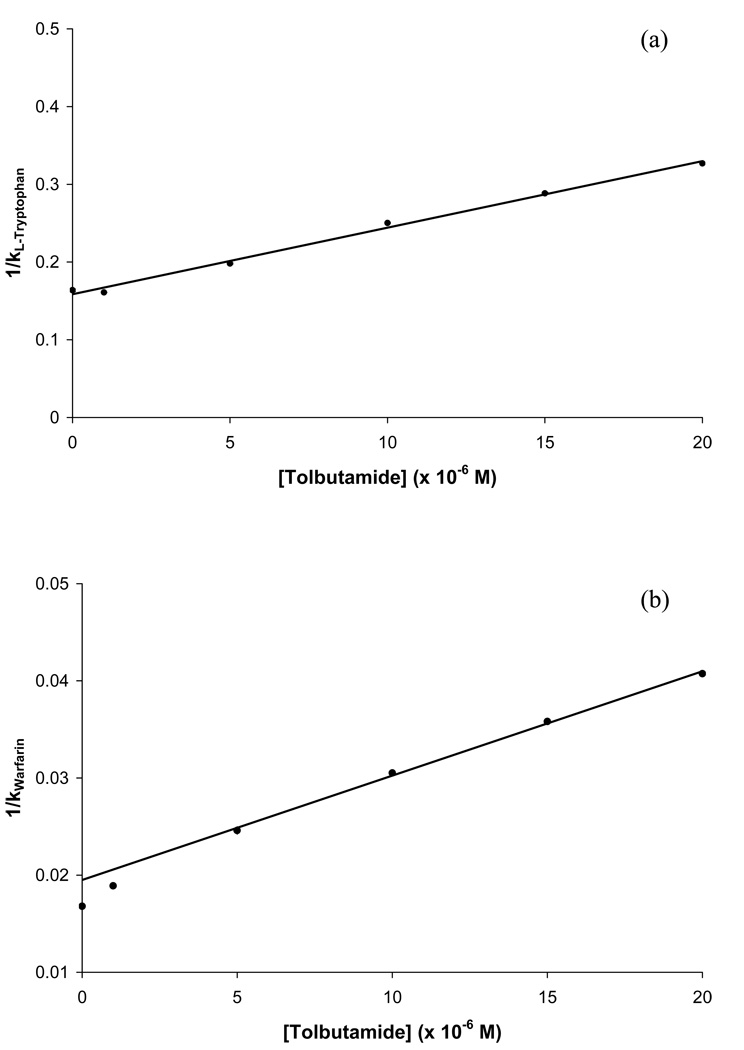
Figure 7.
Plots of 1/k versus [Tolbutamide] for competition studies performed by zonal elution using (a) L-tryptophan or (b) R-warfarin as site-selective probes injected onto HSA columns in the presence of various concentrations of tolbutamide as a competing agent. The equations for the best-fit lines shown in these plots are as follows: (a) y = 8400 (± 300) x + 0.157 (± 0.003), with a correlation coefficient of 0.998 (n = 6); (b) y = 1070 (± 30) x + 0.0194 (± 0.0004), with a correlation coefficient of 0.999 (n = 4). Error bars representing a range of ±1 S.D. are included in this plot but the corresponding ranges are small and not easily visible on the scale employed for this plot).

