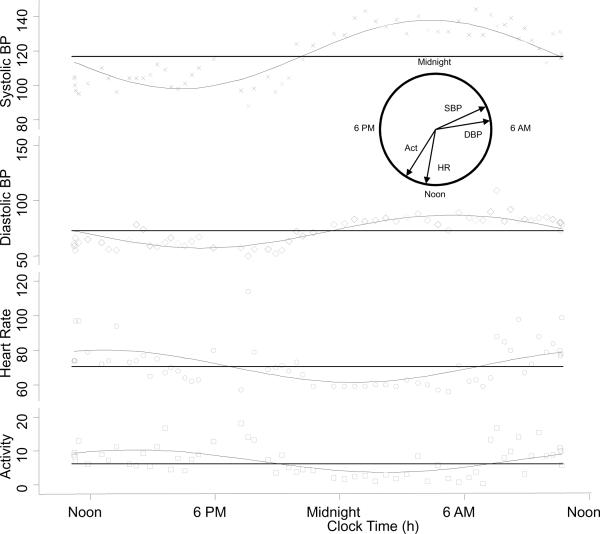
Figure 1.
Circadian variation in blood pressure, heart rate, and concomitant activity is shown for a patient with kidney disease. The horizontal lines are the median estimating statistic of rhythm (MESOR). The circular inset shows the time of peak effect (acrophase) on a 24 hour clock. Acrophases for both systolic and diastolic BP are seen during the hours of sleep. Acrophases for heart rate and activity are seen between noon and 6 PM. Activity units are arbitrary and taken as the square root of the average activity 5 minutes prior to each blood pressure measurement.

