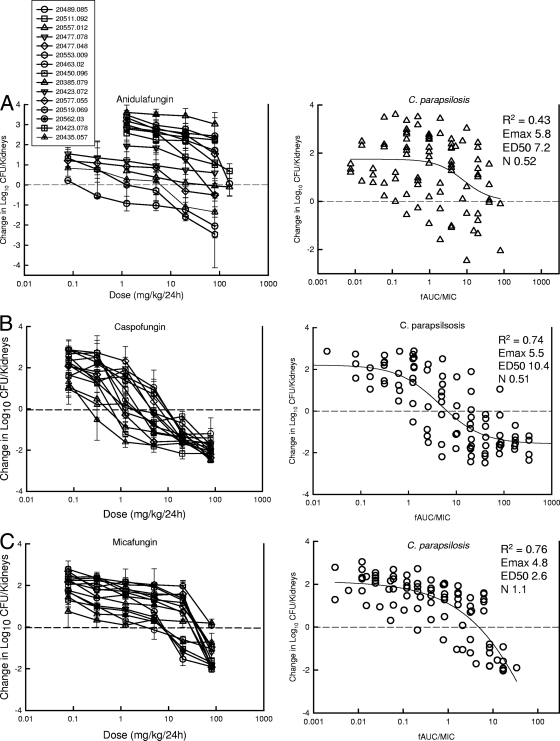
FIG. 4.
Relationship between anidulafungin (A), caspofungin (B), and micafungin (C) exposure (left panel, dose [mg/kg]; right panel, fAUC/MIC) and the burden of organisms in the kidneys of mice after 96 h of therapy against C. parapsilosis. Each symbol represents the mean log10 CFU/kidneys of three mice. Efficacy on the y axis is expressed as the change in log10 CFU/kidneys compared to organism burden at the start of therapy. The horizontal dashed line represented the burden of organisms at the start of therapy. The solid line drawn through the data points represents the best fit line. The R2 is the coefficient of determination from regression using a sigmoid Emax model. The Emax is the maximal effect, the ED50 is the exposure value associated with 50% of Emax, and N is the slope of the regression.

