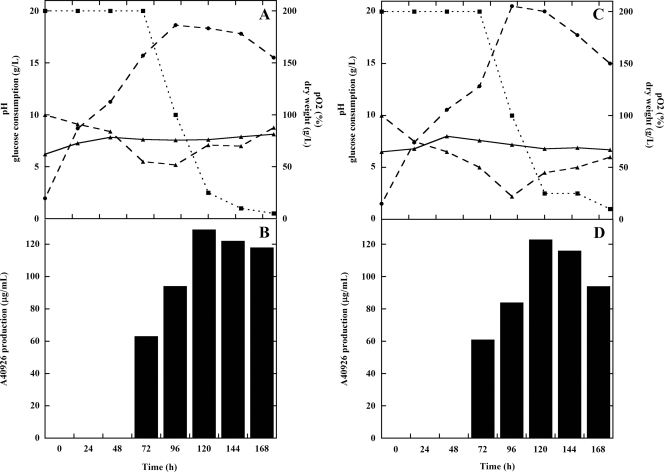
FIG. 5.
Comparison of A40926 production in 2-liter-batch fermentations of Nonomuraea sp. ATCC 39727 (A and B) and the ΔvanY mutant (C and D). Panels A and C: time course of pH, ▴, solid line; pO2, ▴, dashed line; glucose, ▪, dotted line; growth curve measured as dry weight, •, dashed line. Panels B and D, production of A40926 measured by HPLC analysis expressed as μg/ml, filled bars.

