FIG. 3.
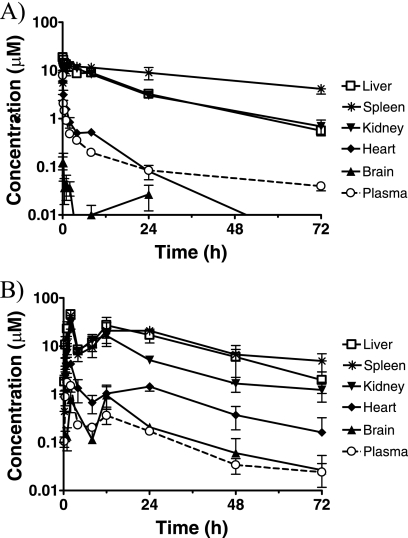
DB766 tissue concentrations in mice after a single i.v. (A) or p.o. (B) administration of DB766. Plasma concentrations were plotted for the purpose of comparison. Tissue concentrations were calculated assuming that 1 g of wet tissue equals 1 ml in volume. Symbols and error bars denote the means and standard errors, respectively, of triplicate determinations.

