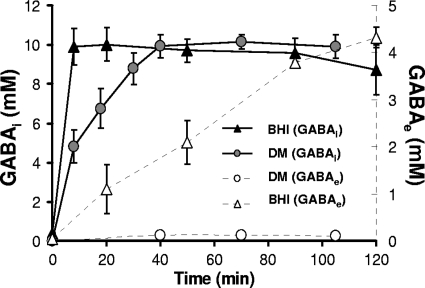
FIG. 5.
Accumulation of GABAi over time in stationary-phase cells of L. monocytogenes 10403S in BHI or DM at pH 3.5. The concentration of GABAe is demonstrated on the secondary axis (dashed lines). Values are means of experiments performed in triplicate. Error bars represent standard deviation (n = 3).

