FIG. 1.
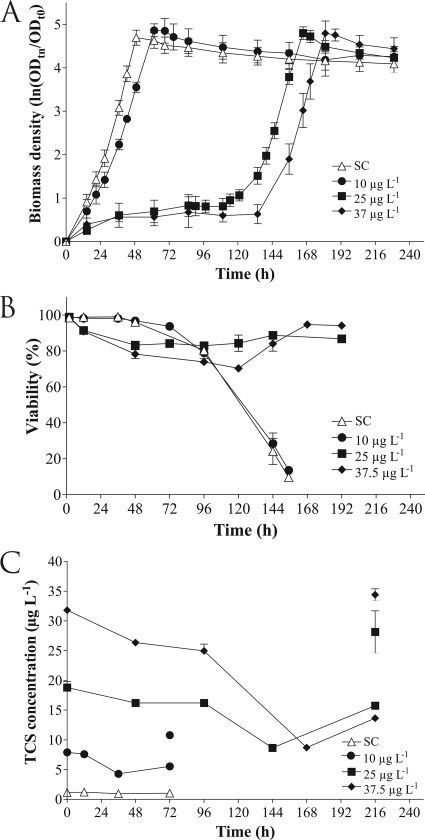
(A) Growth curves for R. rubrum S1H with and without TCS. The error bars indicate the standard deviations of five biological replicates. ODt0, optical density at 680 nm when the culture was inoculated; ODtn, optical density at 680 nm at sampling time tn, where n is the number of hours. (B) Bacteriostatic effect and toxicity of TCS in R. rubrum S1H determined by a flow cytometric viability assay during the course of the growth experiment. Viability is expressed as the percentage of total cells. (C) Determination of the TCS concentration in solution during the course of the growth experiment. The first value was obtained 2 h after inoculation of the cultures to allow adsorption to equilibrate. The separate values at 72 h and 216 h indicate the total amounts of TCS recovered at the end of the growth experiment by extraction of the TCS from both the liquid and the particulate phase. ▵, solvent control samples with methanol (SC); •, samples chronically exposed to 10 μg liter−1 TCS; ▪, samples chronically exposed to 25 μg liter−1 TCS; ⧫, samples chronically exposed to 37.5 μg liter−1 TCS.

