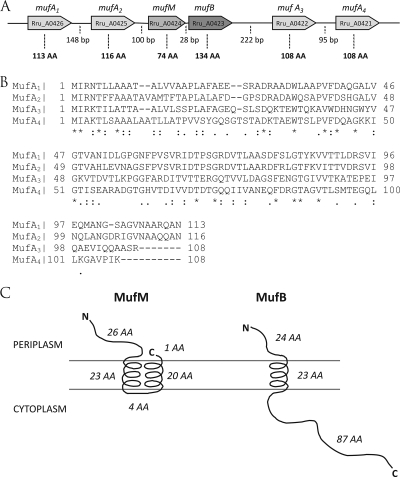
FIG. 2.
(A) Schematic diagram of the micropollutant-upregulated factor (muf) cluster in the R. rubrum S1 genome. The intergenic region lengths are indicated by the numbers of base pairs, and the protein lengths are indicated by the numbers of amino acids (AA). (B) Multiple alignment of the four MufA paralogs encoded by genes in the muf cluster in the R. rubrum S1 genome, constructed using the clustalW2 algorithm. Only mufA1 and mufA2 appeared to be responsive to TCS. Asterisks indicate conserved amino acids; colons indicate highly conserved amino acids; and periods indicate slightly conserved amino acids. (C) Diagram of the cellular localization of the MufM and MufB proteins as predicted by MaGe. The solenoid shapes represent membrane-encompassing helices. N, N terminus of the protein; C, C terminus of the protein; AA, amino acids.

