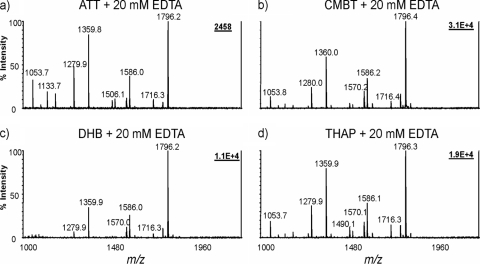
FIG. 3.
MALDI-TOF mass spectra of lipid A from E. coli O116 obtained with 20 mM EDTA ammonium in different matrices. Four different matrices, ATT (a), CMBT (b), DHB (c), and THAP (d), were used. Other conditions were the same as those in the legend to Fig. 2.

