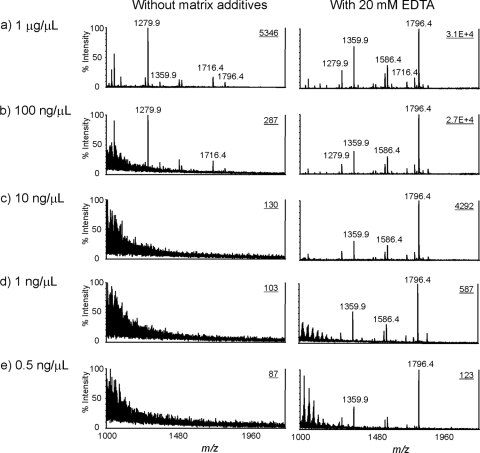
FIG. 5.
Mass spectra of lipid A in serially diluted solutions obtained with or without the addition of 20 mM EDTA ammonium to the matrix. The concentrations of lipid A were 1 μg/μl (a), 100 ng/μl (b), 10 ng/μl (c), 1 ng/μl (d), and 0.5 ng/μl (e). Other conditions were the same as those in the legend to Fig. 2.

