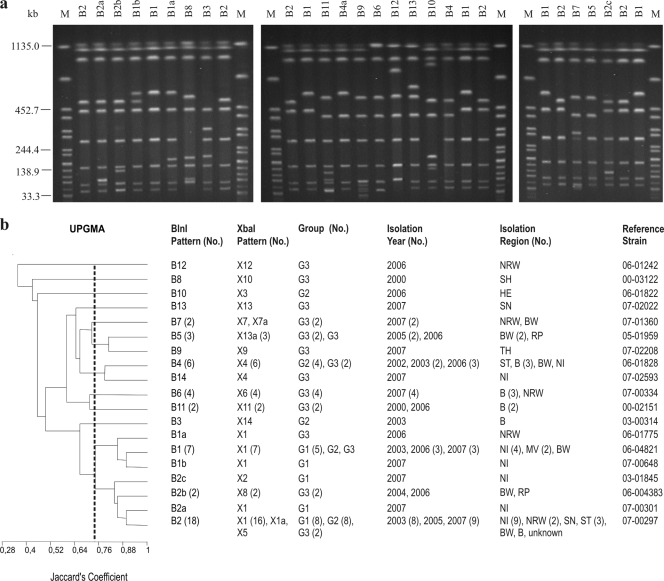
FIG. 2.
(a) BlnI PFGE profiles of representative S. Saintpaul isolates. To define profiles, only bands at >33 kb were considered. Similar profiles with only a one-band difference were designated by letters. Profiles with differences in two or more bands were designated by numbers. Profiles B1, B1a, B1b, B2, and B2a are the profiles of the clonal line. Lane M contained XbaI-digested DNA of S. enterica serovar Braenderup H9812, which was used as a size standard. (b) Dendrogram showing the genetic similarity between BlnI profiles determined by using the unweighted-pair group method with arithmetic averages (UPGMA) and Jaccard's coefficient (J). The numbers in parentheses are the numbers of isolates when there was more than one isolate. G1, group 1 (baseline study); G2, group 2 (diagnostic feces study); G3, group 3 (diagnostic food study). Abbreviations for isolation regions in Germany are explained in Table 1. The B1, B1a, B1b, B2, B2a B2b, and B2c profiles clustered together at a Jaccard's coefficient of 0.75.

