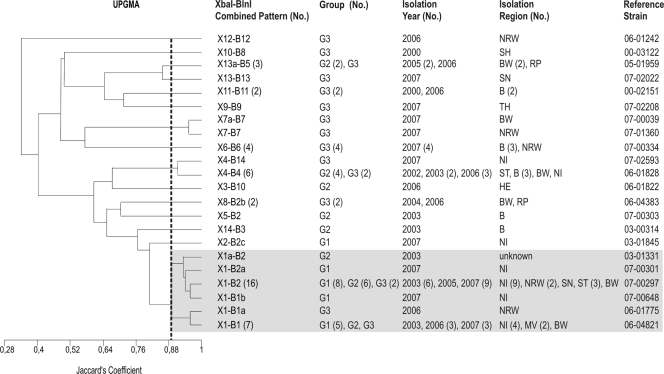
FIG. 3.
Dendrogram showing the genetic similarity between combined XbaI-BlnI profiles determined by using the unweighted-pair group method with arithmetic averages (UPGMA) and Jaccard's coefficient (J). The numbers in parentheses are the numbers of isolates when there was more than one isolate. G1, group 1 (baseline study); G2, group 2 (diagnostic feces study); G3, group 3 (diagnostic food study). Abbreviations for isolation regions in Germany are explained in Table 1. The shading indicates related clonal patterns at a Jaccard's coefficient of 0.90.

