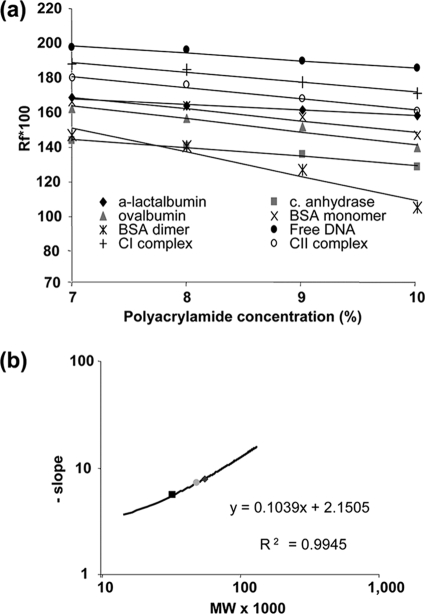
FIG. 4.
Determination of the stoichiometry of XylS-CTD-DNA complexes by native PAGE. Protein markers and XylS bound to DNA sequence were electrophoresed at different polyacrylamide concentrations. (a) The logarithms of the relative mobilities of XylS-CTD-DNA complexes and marker proteins with respect to bromophenol blue were first plotted as a function of polyacrylamide concentration. (b) The slope of the regression equation obtained for each marker is plotted against their molecular weight (MW). The values for free DNA (black squares), CI (light gray triangles), and CII (dark gray diamonds) are depicted, and their molecular weights were extrapolated according to the equation y = 0.1039x + 2.1505. The marker proteins used were carbonic (c.) anhydrase, α-lactalbumin, bovine serum albumin dimer, bovine serum albumin monomer, and ovalbumin.

