
FIG. 6.
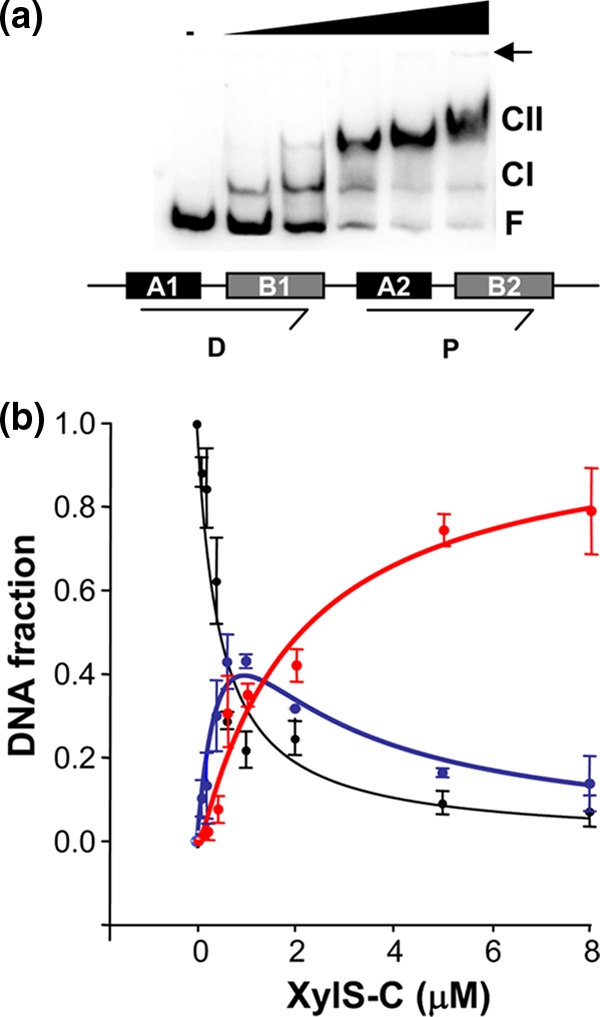
Analysis of XylS-CTD binding to Pm. (a) Representative EMSA of XylS-CTD binding to the DNA containing the XylS binding sites shown under the gel as a scheme. The XylS-CTD concentrations were 0, 80 nM, 400 nM, 1.5 μM, 2.5 μM, and 5 μM. CI, complex 1; CII, complex 2; F, free DNA. A small arrow indicates the loading wells in the gel. (b) Quantitation average of gel shift assay data from five independent experiments. The free DNA (black circles), CI complex (blue), and the CII complex (red) were quantified in a PhosphorImager. Lines represent the best fit of the data to equations 1 to 3 (equation 1, black; equation 2, blue; and equation 3, red [see Materials and Methods]). The regression coefficients for each fit were Rfree = 0.952, RCI = 0.957, and RCII = 0.978. Error bars correspond to standard deviation values.