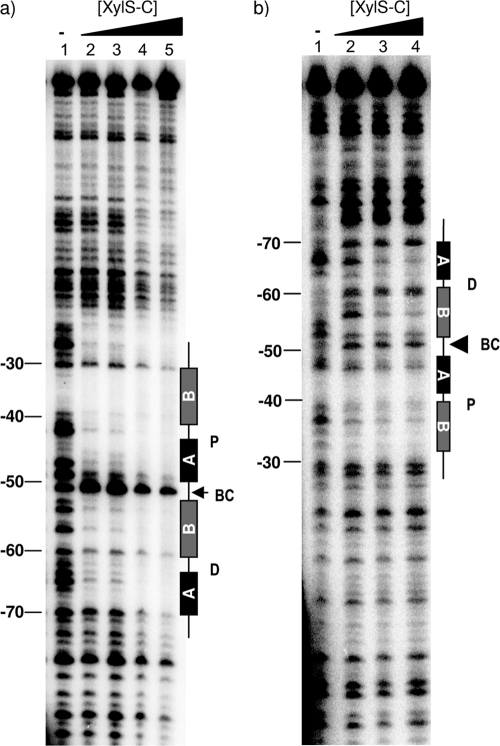
FIG. 7.
DNase I footprint analysis of XylS-Pm complexes. (a) Upper strand; (b) bottom strand. Lane 1, free DNA. The XylS-CTD concentrations used were as follows: (a) 1 μM (lane 2), 2 μM (lane 3), 5 μM (lane 4), and 10 μM (lane 5); (b) 500 nM (lane 2), 1 μM (lane 3), and 2 μM (lane 4). The position of the region corresponding to the distal (D) and proximal (P) sites is indicated. BC, bending center. The band position in free DNA was determined by comparison with a Maxam and Gilbert sequence ladder (not shown).

