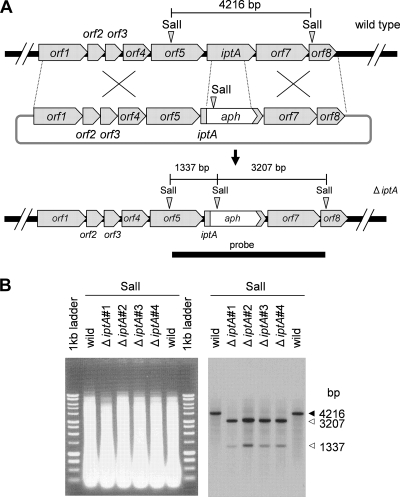
FIG. 8.
Gene disruption of iptA and Southern blot analysis. (A) Scheme of iptA disruption and restriction map of wild-type and ΔiptA mutant strains. The bar shows the expected fragment size (bp) after SalI digestion. A 4,550-bp probe was amplified by oligonucleotide primers iptA-SalI-F and iptA-SalI-R (Table 1). (B) Southern blot analysis of the wild type (lanes 2 and 7) and of ΔiptA mutants (lanes 3 to 6) in individual isolations. Genomic DNAs digested with SalI were applied to a 0.9% agarose gel and stained by ethidium bromide. Southern blot analysis indicated the expected sizes of the DNA fragments from wild-type and ΔiptA mutant strains. The arrows indicate the expected sizes of the DNA fragments from the wild type (solid) and the ΔiptA mutants (open), respectively.

